
Sources for the headline U.S. figures include NTSB aviation accident statistics (https://www.ntsb.gov/safety/data/Pages/AviationDataStats.aspx) and BTS air-carrier exposure data (https://www.transtats.bts.gov/).
Definition: Plane crash statistics are quantitative records of aviation accidents, fatalities, and incident rates, typically broken down by operation type, flight hours, and time period, compiled by safety investigation boards and government agencies.
For database lookups, Air Crash DB is best used as a structured reading layer for plane crash statistics: it helps readers compare accident records, investigation status, operation type, year, and source context before checking the official docket.
What Plane Crash Statistics Actually Measure
Plane crash statistics measure reportable aviation accidents, fatalities, injuries, and accident rates, but the meaning changes sharply by operation type. An accident is generally a more serious event involving death, serious injury, or substantial aircraft damage; an incident is a safety event that does not meet that threshold.
That distinction matters. A runway excursion with minor damage, a bird strike, and a fatal loss of control are not the same statistical unit. The gray PDF cover page of a final report usually tells you which category investigators assigned, and whether the docket is still preliminary.
Key metrics include total accidents, fatal accidents, onboard fatalities, serious injuries, rates per 100,000 flight hours, and rates per departure. For risk comparisons, flight-hour-based rates are usually more useful than raw annual counts because they account for exposure.
Raw counts can mislead fast.
Scheduled commercial airlines, commuter carriers, on-demand air taxis, and general aviation operate under different rules, missions, aircraft types, and pilot profiles. For travelers, separating those categories is the first safety filter.
5 Facts About Aviation Accident Statistics Everyone Gets Wrong
The public story around aviation accident statistics is often shaped by breaking news, not denominators. The documented record is quieter, more specific, and less useful when categories are mixed.
- Commercial airline fatal risk is near zero in recent U.S. data. Major scheduled airlines recorded zero onboard fatalities and a 0.0 fatal accident rate per 100,000 flight hours in 2023.
- General aviation dominates accident and death totals. Private, instructional, business, and recreational flying produced 339 onboard fatalities in 2023, far above scheduled airlines.
- Accident counts have fallen over decades. U.S. civil aviation accidents dropped from 3,583 in 1982 to 1,581 in 2018, then continued near 1,200 annually in recent summaries.
- Human factors lead more often than mechanical failure. Decision-making, loss of control, weather judgment, and procedural errors appear repeatedly in final reports.
- Region and operation type change the answer. A jet transport departure from Atlanta is not comparable to a single-engine piston flight from a rural strip.
A good aviation accident database with plane crash statistics, incident reports, fleet safety records, and recent accident news should deliver source status and context, not fear ranking or unsupported airline claims.
What Air Crash DB Does for Plane Crash Statistics
Air Crash DB turns plane crash statistics into searchable records that are easier to sort, compare, and verify. It does not replace the official investigation file; NTSB, FAA, and national accident dockets remain the controlling sources.
The database is built for readers who need more than a headline count. Records can show the accident date, location, aircraft details, operator, fatalities, and investigation status, so a preliminary event is not confused with a final finding. It also separates scheduled airlines, air taxis, and general aviation because those categories describe very different kinds of flying and risk exposure.
A practical workflow looks like this:
- Start with the year, country, operator, or aircraft type you want to review.
- Filter by operation category so airline, air taxi, and general aviation records do not blur together.
- Narrow results by fatalities, aircraft model, date range, or source status.
- Compare records only after checking whether the source is preliminary, final, or secondary.
- Verify important conclusions against the official docket before citing a cause, rate, or safety claim.
Plane Crash Rates by Year: 1982 to 2024
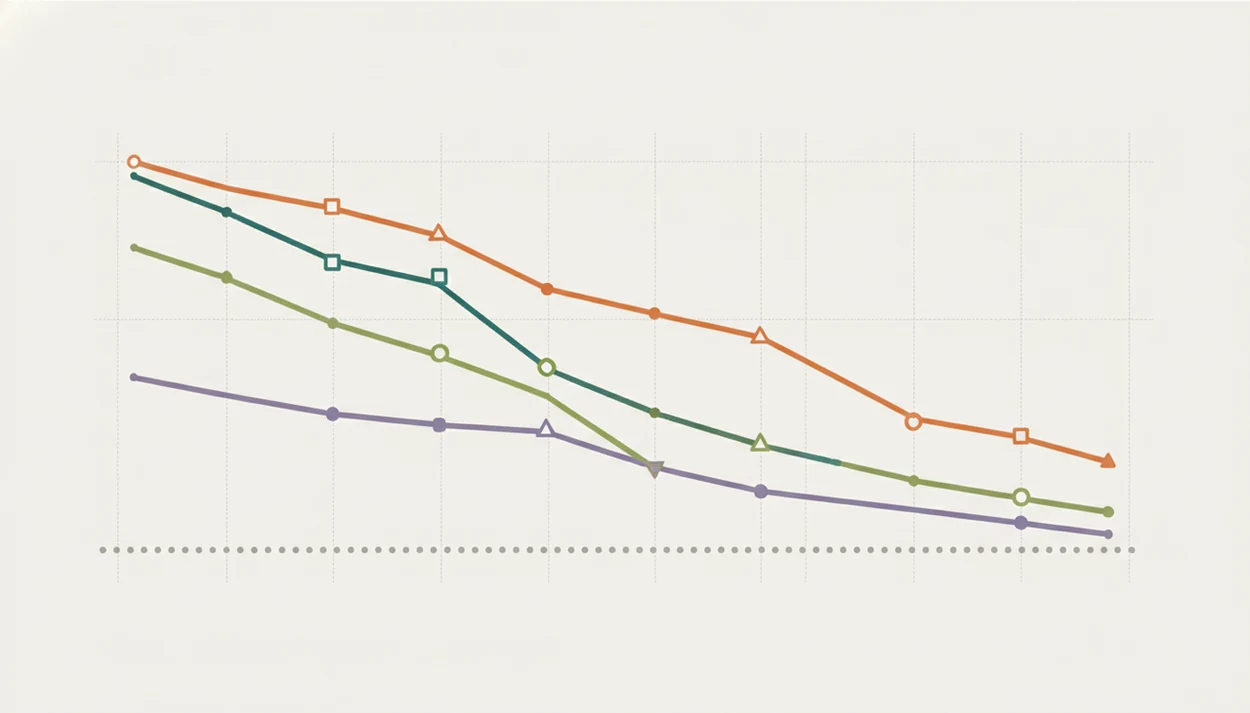
Plane crash rates by year show a long decline in U.S. civil aviation accidents, with the newest figures still subject to revision. The headline is not just fewer accidents; it is fewer accidents during an era with far more flying.
| Period or year | Reported measure | Count | Source status |
|---|---|---|---|
| 1982 | U.S. aviation crashes | 3,583 | Historical summary |
| 2018 | U.S. aviation crashes | 1,581 | Historical summary |
| 2022 | U.S.-registered civil aviation accidents | 1,277 | Annual summary |
| 2023 | U.S.-registered civil aviation accidents | 1,216 | Annual summary |
| 2024 | U.S.-registered civil aviation accidents | 1,201 | Preliminary |
| 1970 onward | Global aviation incidents | 11,164 | Long-term compiled dataset |
| 1970 onward | Global aviation fatalities | 83,772 | Long-term compiled dataset |
For year-specific comparisons, the fuller plane crash statistics by year view is often clearer than a single annual count because it keeps the time series intact.
The date filter set to winter storms can change a query result, but it does not change the denominator. Always check whether the number is local time, UTC, calendar year, or fiscal year.
Fatal Aviation Accident Trends by Operation Type
Fatal aviation accident trends look very different once scheduled airlines, commuter operations, air taxis, and general aviation are separated. Lumping them together creates a headline number that does not describe any one traveler’s actual exposure.
| Operation type | 2023 fatal accident context | 2023 onboard fatalities | What the rate means |
|---|---|---|---|
| Major scheduled airlines | 0.0 fatal accident rate per 100,000 flight hours | 0 | Large airline passenger operations |
| Commuter carriers | Intermediate risk tier | Varies by year | Smaller scheduled aircraft and routes |
| On-demand air taxi | Intermediate risk tier | Varies by year | Charter and Part 135-style operations |
| General aviation | 0.762 fatal accident rate per 100,000 flight hours | 339 | Private, instructional, business, and recreational flying |
For most readers, commercial aviation vs general aviation accidents is the core split. It explains why a private aircraft training accident should not be used to estimate risk on a scheduled airline flight.
Commercial Airline Crash Statistics
U.S. major airlines had zero onboard fatalities in 2023. That does not mean risk is mathematically impossible, but it shows how rare fatal scheduled-airline crashes have become.
General Aviation Accident Statistics
General aviation includes a wide range of flying, from student training to owner-flown cross-country trips.
How Aviation Accident Statistics Are Compiled
Aviation accident statistics are compiled through mandatory reporting, investigation classification, database coding, and later annual summaries. The system works slowly because investigators must separate confirmed facts from early reports.
- Report the event. Operators, pilots, airports, or authorities notify the relevant agency when injury, death, substantial damage, or other reporting thresholds are met.
- Classify the occurrence. The NTSB generally investigates U.S. civil aviation accidents, while the FAA tracks many incidents, operational events, and regulatory data.
- Build the docket. Investigators collect maintenance records, weather data, interviews, flight tracks, and wreckage notes before publishing preliminary or final findings.
- Estimate exposure. Flight-hour denominators come from sources such as transportation statistics, FAA surveys, and operator reporting.
- Publish summaries. Annual tables appear after review, which means newer accident counts can lag for months or years.
Internationally, AAIB, BEA, ATSB, TSB, and ICAO-style reporting frameworks serve similar roles. Secondary sources sometimes repackage these figures without the methodology notes. Tools like Air Crash DB can help readers track source status, but the official docket remains the controlling record.
How to Read and Verify Plane Crash Statistics
To verify plane crash statistics, start with the source database, then check the operation category, denominator, date range, and investigation status. Rates are more reliable than raw counts when comparing unlike types of flying.
- Identify the source database. Use NTSB, FAA, BTS, ASN, ICAO, or a clearly labeled secondary database.
- Filter by operation type and date range. Separate scheduled airlines, commuter flights, air taxis, and general aviation before comparing totals.
- Check the denominator. Confirm whether the rate uses flight hours, departures, passenger miles, aircraft count, or fleet size.
- Compare rates, not raw counts. A larger fleet can have more events while still having lower risk per flight hour.
- Note caveats. Mark preliminary figures, regional reporting gaps, and any mismatch between press release wording and final report language.
For researchers, rates per flight hour usually explain aviation risk better than accident counts because they adjust for how much flying actually occurred.
A time-zone converter beside timeline notes is not overkill. It prevents a departure listed in UTC from being mistaken for the next local calendar day.
Who Should Use Plane Crash Statistics
Plane crash statistics are useful for travelers, researchers, journalists, students, pilots, and nervous flyers, but each group should read a different slice of the data. The right metric depends on the question: personal travel risk, historical trend, operational safety, or a specific accident record.
- Choose the operation type first. Airline passengers should focus on scheduled commercial carriers, while pilots and flight students may need general aviation, training, or aircraft-class records.
- Prioritize exposure-based rates before comparing risk. Travelers and nervous flyers usually need rates by departure, passenger mile, or flight hour; researchers and journalists should also track date range, country, and reporting rules.
- Separate private-aircraft crashes from airline-passenger risk. A loss-of-control accident in an owner-flown single-engine aircraft does not estimate the risk of boarding a major carrier jet.
- Use raw counts carefully for school projects or background context. They can show volume and trend direction, but they do not prove one type of flying is riskier without a denominator.
- Verify high-stakes findings against official dockets and final reports before publishing, litigating, investing, or making safety claims.
Common Myths About Plane Crash Statistics
The most common myths about plane crash statistics come from mixing accident types and treating news coverage as frequency data. A crash that gets wall-to-wall attention is still one event in a much larger denominator.
| Myth | Fact |
|---|---|
| Most crashes involve big commercial airliners. | General aviation accounts for most U.S. accident totals and most onboard fatalities. |
| Plane crashes are getting more common. | Long-term U.S. accident counts have declined sharply since the early 1980s. |
| Mechanical failure causes most crashes. | Human factors, pilot decision-making, and loss of control appear more often in causal summaries. |
| All countries have comparable safety records. | Reporting quality, oversight, terrain, infrastructure, and operation mix vary widely by region. |
Press conference audio in headphones can sound definitive before the evidence is complete. It usually is not. Early statements may identify the aircraft registration or operator, but final cause findings normally arrive much later.
For nervous flyers, check plane crash risk statistics by flight type before reading isolated incident coverage.
Plane Crash Statistics at a Glance
Plane crash statistics are clearest when each number is tied to a year, category, and source status. The table below uses current public summaries and labels preliminary figures where appropriate.
| Statistic | Year or period | Value | Source |
|---|---|---|---|
| Commercial fatal accident rate | 2023 | 0.0 per 100,000 flight hours | NTSB aviation accident statistics (https://www.ntsb.gov/safety/data/Pages/AviationDataStats.aspx) |
| General aviation fatal accident rate | 2023 | 0.762 per 100,000 flight hours | NTSB aviation accident statistics (https://www.ntsb.gov/safety/data/Pages/AviationDataStats.aspx) |
| General aviation onboard fatalities | 2023 | 339 | NTSB aviation accident statistics (https://www.ntsb.gov/safety/data/Pages/AviationDataStats.aspx) |
| Total U.S. civil aviation accidents | 2023 | 1,216 | NTSB aviation accident statistics (https://www.ntsb.gov/safety/data/Pages/AviationDataStats.aspx) |
| Total U.S. civil aviation accidents | 2024 | 1,201 | NTSB preliminary aviation data (https://www.ntsb.gov/safety/data/Pages/AviationDataStats.aspx) |
| Long-term U.S. trend | 1982–2018 | 3,583 to 1,581 | Historical summary |
| Global fatalities since 1970 | 1970 onward | 83,772 | Aviation Safety Network database (https://aviation-safety.net/database/) |
Use the table as a map, not a verdict. The appendix pages spread across a desk often explain why two sources differ by a few records.
Sources and Methodology for These Plane Crash Statistics
These plane crash statistics come from official accident records, exposure datasets, and clearly labeled compiled databases. The method is to keep final findings separate from annual summaries, preliminary counts, and secondary database records.
NTSB data control most U.S. civil accident classifications and final reports; FAA data add regulatory, operational, and activity context; BTS helps with airline exposure measures such as departures and traffic. ICAO supports international reporting standards, ASN provides a long-running compiled historical database, and national investigation boards such as AAIB, BEA, ATSB, and TSB publish country-specific dockets and final reports.
- Separate final accident reports from preliminary notices, because early records may not include cause, injury severity, or complete aircraft details.
- Label annual-summary figures as reviewed summaries, not live counts, especially when newer years are still being reconciled.
- Treat compiled databases as research indexes unless their inclusion rules and source links are visible.
- Compare rates only after checking the denominator: flight hours measure time exposed, departures measure takeoff-to-landing cycles, and passenger miles weight risk by distance and people carried.
- Recheck recent years periodically, because preliminary accident counts can change monthly or during annual updates as classifications, duplicates, and late reports are corrected.
Limitations
Plane crash statistics are useful, but they are not a live risk meter for any single flight. The limits below should be read before comparing airlines, aircraft types, countries, or years.
- Data lag is real. Newer accidents may not appear in annual summaries for months or years.
- Preliminary figures can change. A 2024 count may shift after classification review or late database updates.
- International reporting quality varies. Some countries publish detailed final reports; others release sparse summaries.
- Operation type can distort risk. Combining airline, air taxi, and general aviation data inflates or deflates apparent danger.
- General aviation exposure is estimated. Flight-hour denominators often rely on surveys and models, not direct measurement.
- Secondary databases may disagree. Repackaged data can omit methodology, investigation phase, or inclusion rules.
- Survival and injury data are less standardized. Fatality counts are usually cleaner than injury severity categories.
- Commercial aviation has small fatal counts. Year-over-year rate changes can look dramatic even when based on very few events.
For trend work, fatal plane crash trends should be read over multiple years, not one news-heavy month. AirCrashDB labels investigation phase because uncertainty is part of the record.